
Gain an in‐depth understanding of Elliott Wave Theory—from its origins and core principles to its intricate relationship with Fibonacci ratios. This guide is designed for financial professionals and serious market practitioners seeking to align their technical analyses with proven market patterns.
1. Elliott Wave Theory: A Modern Framework for Today’s Markets
1.1 Origins and Fundamental Concept
Elliott Wave Theory, named after Ralph Nelson Elliott (28 July 1871 – 15 January 1948), revolutionized market analysis by revealing the fractal nature of price movements. Inspired by the Dow Theory and natural phenomena, Elliott observed that market prices move in predictable wave patterns. His seminal work, The Wave Principle (1938), laid the groundwork for forecasting price actions via recurrent wave structures.
1.2 The Classic 5-3 Wave Motive
At its core, Elliott’s model posits that price trends advance in five-wave sequences (motive waves) while corrections manifest in three-wave structures. In an upward market, the motive sequence is numbered as 1 through 5, with the countertrend correction labeled as A, B, and C. Importantly, these structures are fractal: each larger wave contains smaller, similar wave patterns. When combined with Fibonacci relationships, these patterns offer actionable insights into potential risk/reward opportunities.
1.3 Motive and Corrective Wave Structures in Detail
In every trend cycle, impulse moves (waves 1, 3, and 5) provide the primary directional thrust, while waves 2 and 4 act as corrective retracements. For instance, within a larger motive wave, each impulse can be further decomposed into five lower-degree waves. In bearish markets, these patterns invert—resulting in five waves down followed by a three-wave upward correction.
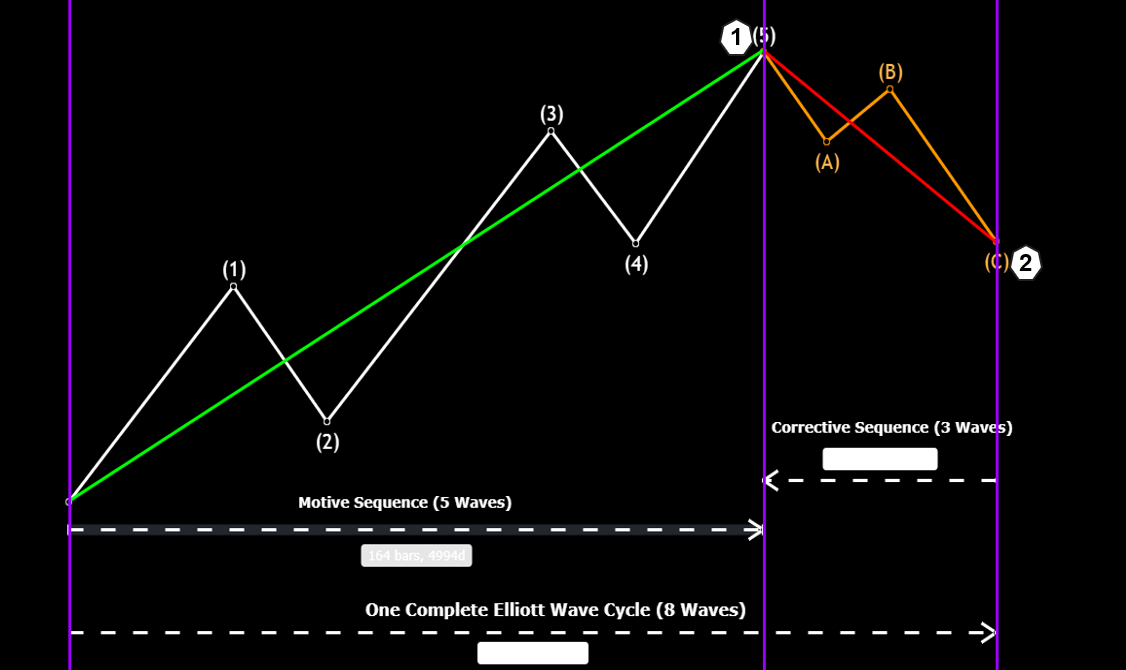
Figure 1.3 – Diagram: 5‑Wave Motive & 3‑Wave Corrective Breakdown
1.4 Wave Degrees and Market Cycles
Elliott introduced a nomenclature identifying nine degrees of waves—from the Grand Super Cycle (typically visible on weekly or monthly charts) to the Subminuette (commonly noted on hourly charts). This hierarchical structure enables precise positioning of market moves within the broader cyclical evolution, ensuring a granular approach to technical analysis.
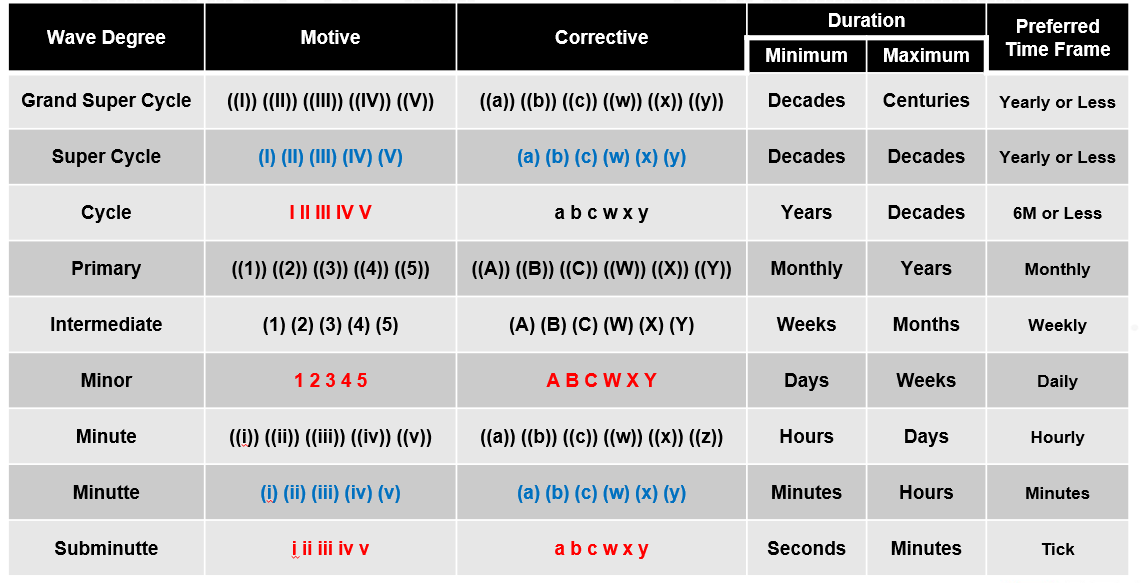
Figure 1.4 – Diagram: Wave Degree Hierarchy
1.5 The Impact of Algorithmic Trading
In today’s era of algorithmic and high-frequency trading, market participants execute trades based purely on quantitative analysis. This evolution has prompted a critical reassessment of classical Elliott wave patterns. Modern market conditions suggest that while the 5-wave move remains valid, market trends frequently exhibit three-wave impulsive behavior. Hence, contemporary analysts might consider referring to these as “motive sequences” rather than insisting on a strict five-wave framework.
1.6 Adapting Elliott Wave for Modern Markets
Modern markets—encompassing stocks, forex, commodities, and bonds—demand flexibility. Whereas Elliott’s early work was rooted in the stock market, current observations indicate that certain assets, particularly forex, often progress in three-wave patterns. Consequently, analysts should be open to alternative wave counts rather than forcing every trend into a rigid five-wave mold.
2. Fibonacci: The Mathematical Backbone
2.1 Introduction to Fibonacci in Market Analysis
Leonardo Fibonacci of Pisa (circa 1170–1250) introduced the sequence and the attendant ratios that now underpin essential technical analysis tools. His work, outlined in Liber Abacci, demonstrated how Fibonacci numbers can transform our understanding of numerical relationships, paving the way for their application in financial markets.
2.2 The Fibonacci Series and Its Legacy
Beginning with 0 and 1, the Fibonacci series evolves by summing the two previous terms—yielding a sequence such as 0, 1, 1, 2, 3, 5, 8, 13, 21, and so forth. The famed Golden Ratio of approximately 1.618 emerges naturally when a number in the series is divided by its predecessor, embodying a fundamental proportion observed in nature, art, and finance.
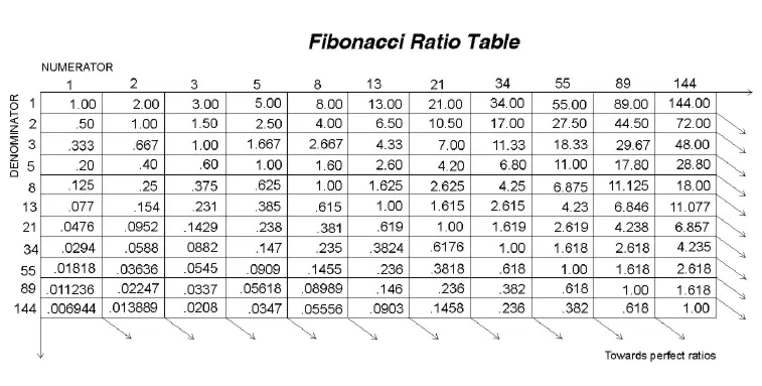 Figure 2.2 – Diagram: Fibonacci Ratio Table
2.3 Critical Fibonacci Ratios in Technical Analysis
Traders frequently reference Fibonacci retracement and extension levels as potential support and resistance zones. Common ratios such as 0.382, 0.618, and 1.618 derive directly from the series, while others like 0.382 (obtained by dividing a number by the one two places ahead) reinforce the predictive power of these ratios in forecasting market corrections and move extensions.
2.4 Fibonacci Retracement and Extension in Practice
Retracements: Identify countertrend zones where corrections may reverse and resume the prevailing trend.
Extensions: Mark target levels for ongoing trends where profit objectives can be effectively placed. These levels are central to developing precise entry and exit strategies that are embedded within Elliott Wave counts.
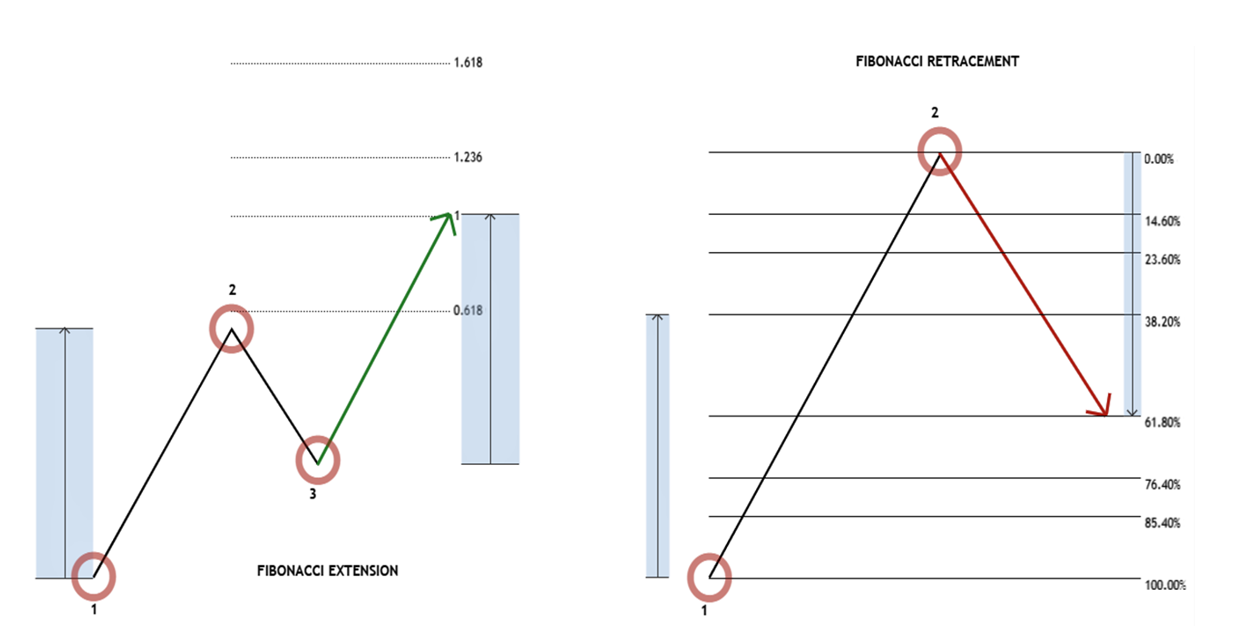
Figure 2.3 – Diagram: Retracement & Extension Levels
2.5 Integrating Fibonacci and Elliott Wave Theory
In an Elliott structure, Fibonacci ratios help measure the relative size of waves:
Wave 2: Typically retraces 50%, 61.8%, 76.4%, or 85.4% of Wave 1.
Wave 3: Often extends to 161.8% of the preceding move.
Wave 4 and Wave 5: Their proportions, calculated relative to earlier waves, provide traders with critical benchmarks for target setting and stop-loss placement.
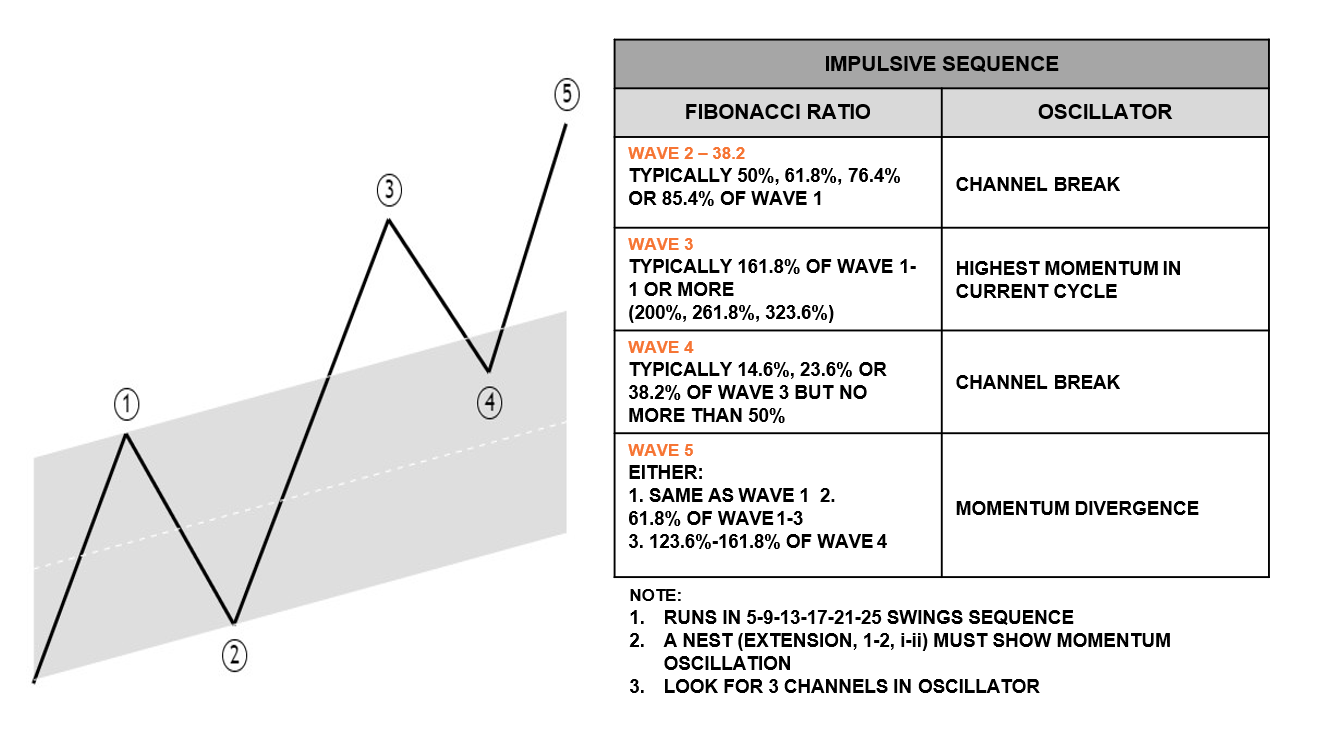
Figure 2.5 – Diagram: Fibonacci Relationships within Impulse
3. Reinterpreting Motive Waves
3.1 Traditional Impulse Waves
Conventionally, motive waves are defined by a five-wave pattern. When subdividing an impulse:
Waves 1, 3, and 5: Propel the trend forward.
Waves 2 and 4: Act as corrective pauses. Trading rules ensure that Wave 2 does not retrace beyond the start of Wave 1, and Wave 3 is rarely the shortest of the impulses, reinforcing the integrity of the pattern.
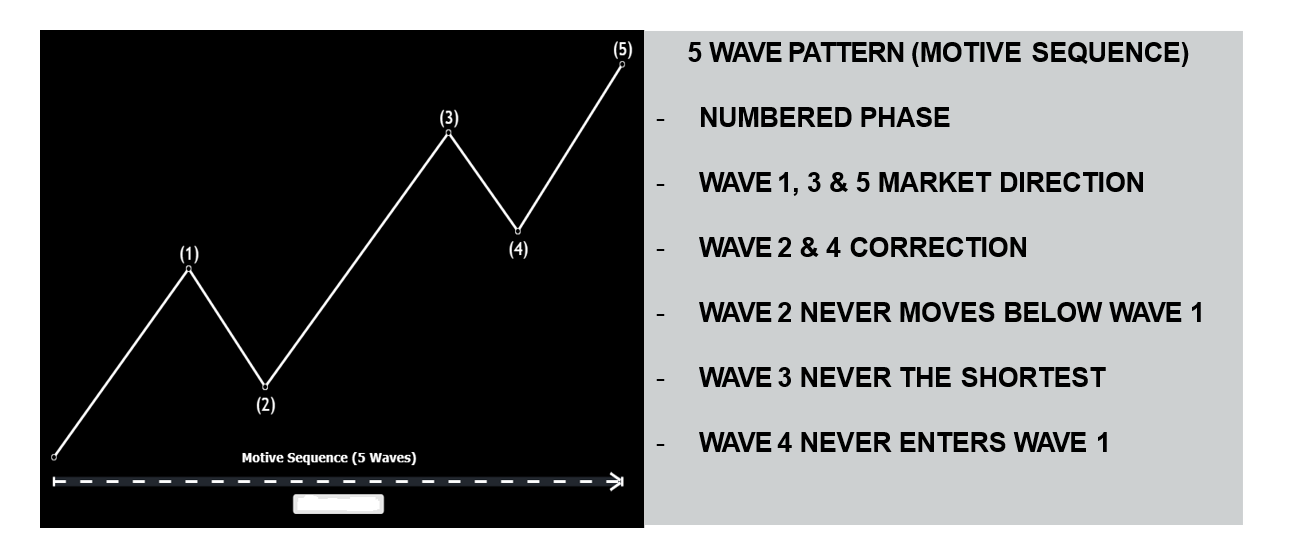
Figure 3.1 – Diagram: Impulse Wave Subdivision
3.2 Impulses with Extensions
Extensions occur when one of the motive waves (typically Wave 3 in stocks or Wave 5 in commodities) extends beyond its usual bounds. This creates an exaggerated, elongated wave that may dominate the overall trend.

Figure 3.2 – Diagram: Impulse with Extension
3.3 Diagonals: Leading and Ending

Leading Diagonals: Often found at the commencement of an impulse or during the A-wave of a corrective zigzag, these patterns feature overlapping waves and a wedge-like appearance.

Ending Diagonals: Occur typically in Wave 5 of an impulse or Wave C of a zigzag, signaling the final thrust of the dominant trend with characteristic overlapping that hints at waning momentum.
3.4 The Modern “Motive Sequence”
Reflecting current market dynamics, many professionals now refer to a “motive sequence” rather than insisting on a strict five-wave mandate. Observations suggest that incomplete wave structures—when counted as 5, 9, 13, 17, 21, etc.—may forecast continued trend extensions without conforming to a traditional impulse model.
4. The Psychological Underpinnings: Waves’ Personality
4.1 Waves 1 and 2: The Subtle Initiation
Wave 1: Typically begins under a cloud of skepticism. Early bullish signals are often dismissed by the market, as negative fundamentals dominate the narrative.
Wave 2: Serves as a corrective pullback which, although bearish in sentiment, remains bounded by the low of Wave 1. Lower trading volumes and a controlled retracement often characterize this phase.
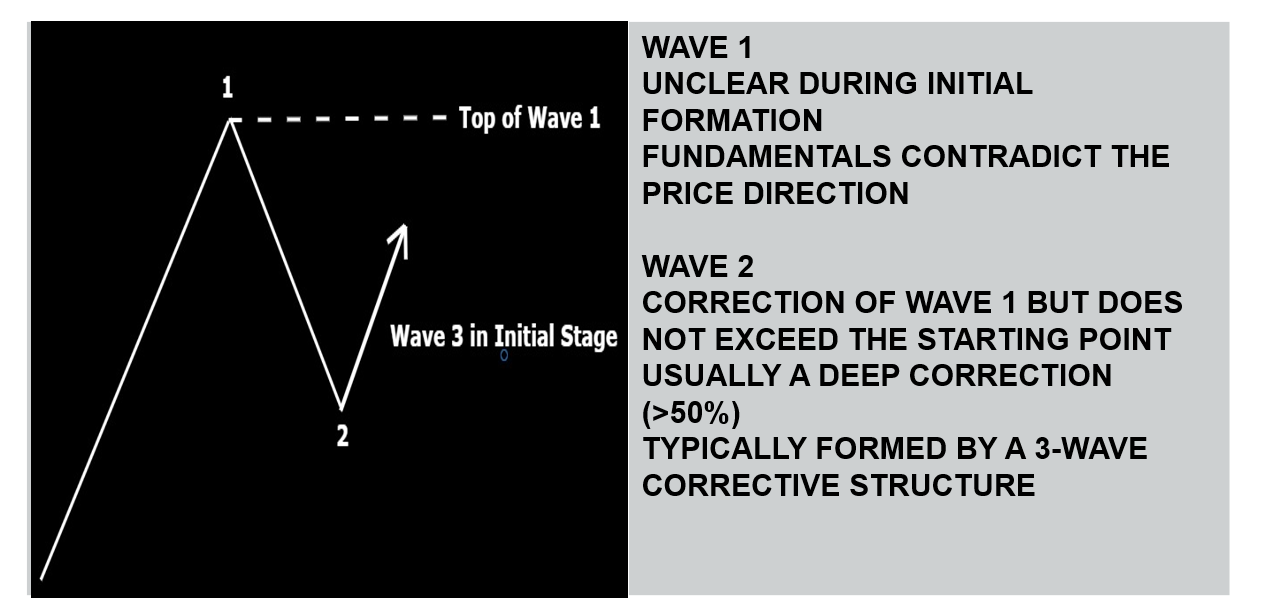
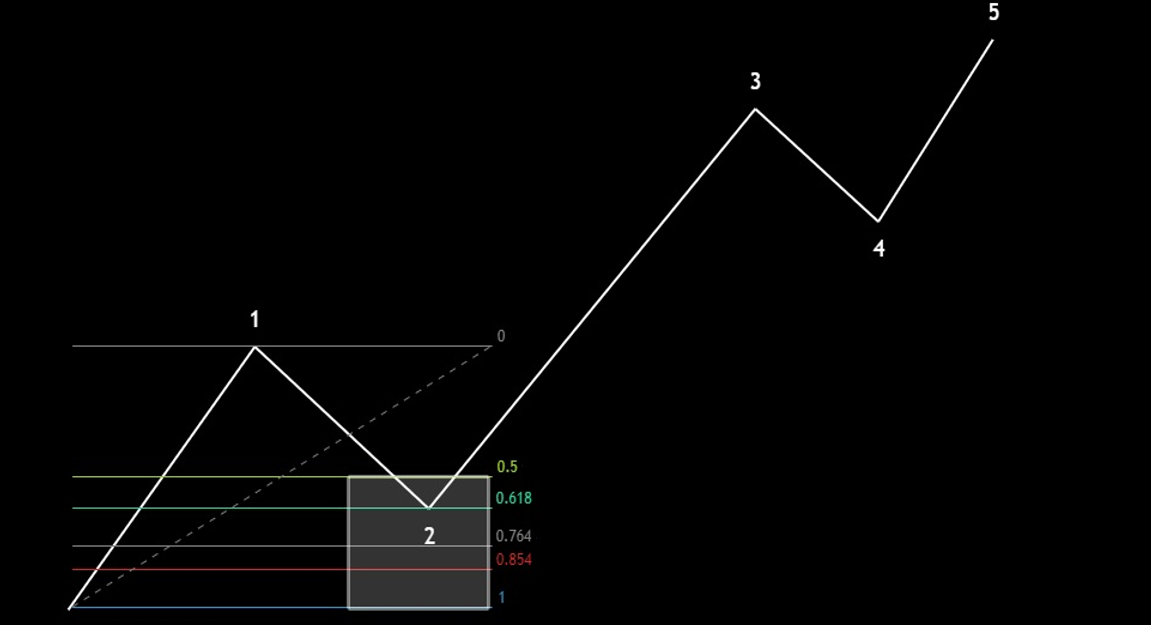
Figure 4.1 – Diagram: Waves 1–2 Sentiment & Volume
4.2 The Robust Advance of Wave 3
Regarded as the market’s powerhouse, Wave 3 is marked by rapid price ascents, increasing volumes, and a transition from bearish to bullish sentiment. As broader market participants align with the rally, momentum picks up dramatically, often accompanied by technical signals such as stop-run gaps.
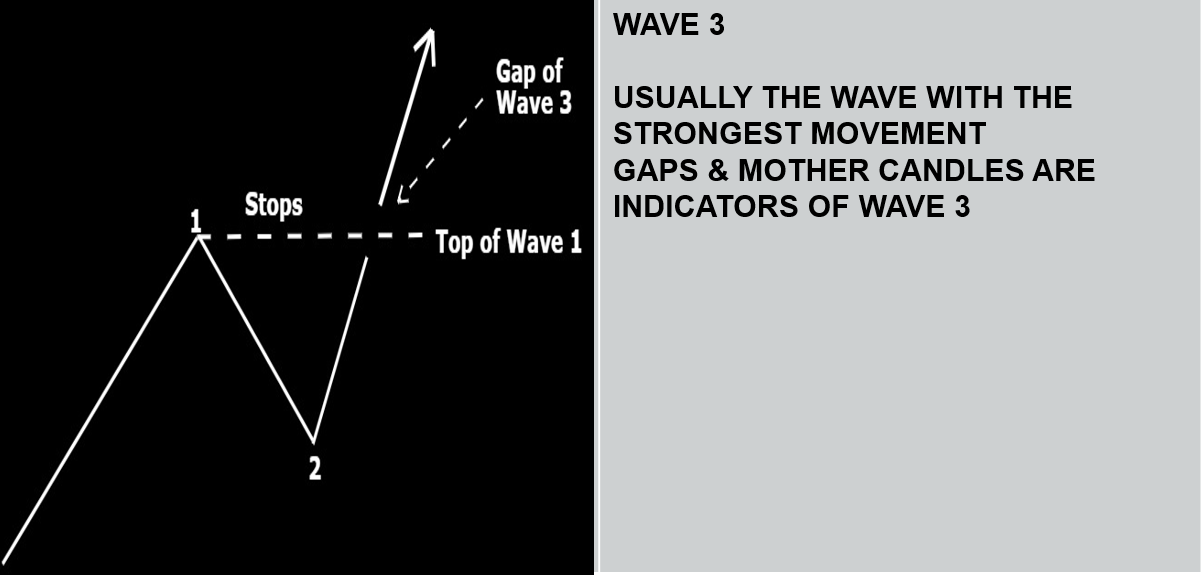
Figure 4.2 – Diagram: Wave 3 Acceleration & Gap Formation
4.3 Wave 4: The Consolidative Pause
Following the dramatic move of Wave 3, Wave 4 typically unfolds as a corrective consolidation. With subdued volume and limited retracement (often less than 38.2% of Wave 3), this phase provides a critical opportunity for investors to position themselves before the final leg.
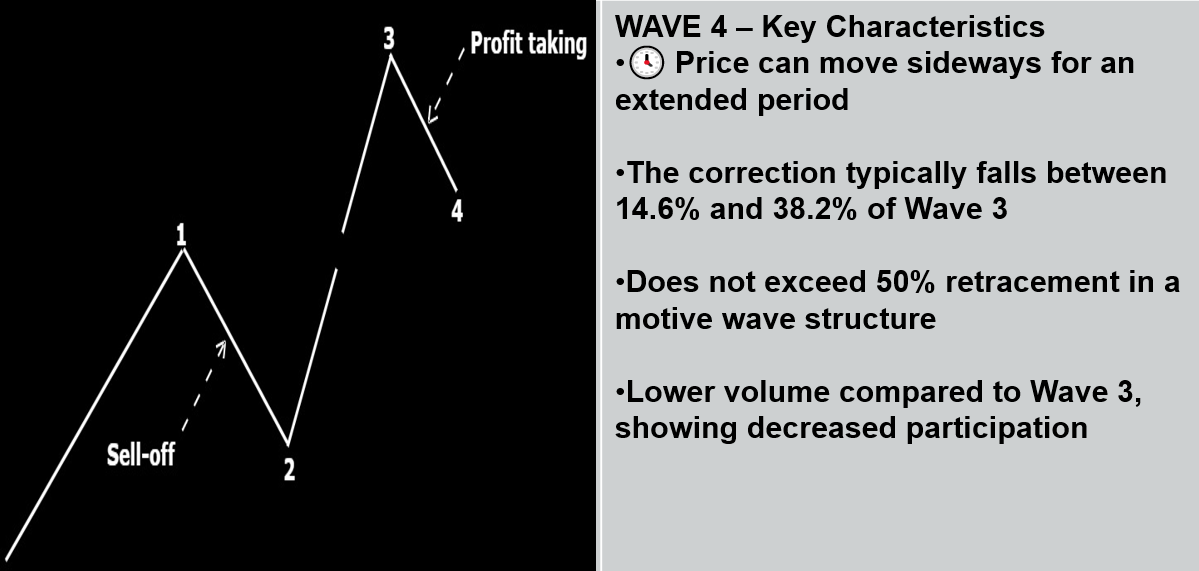
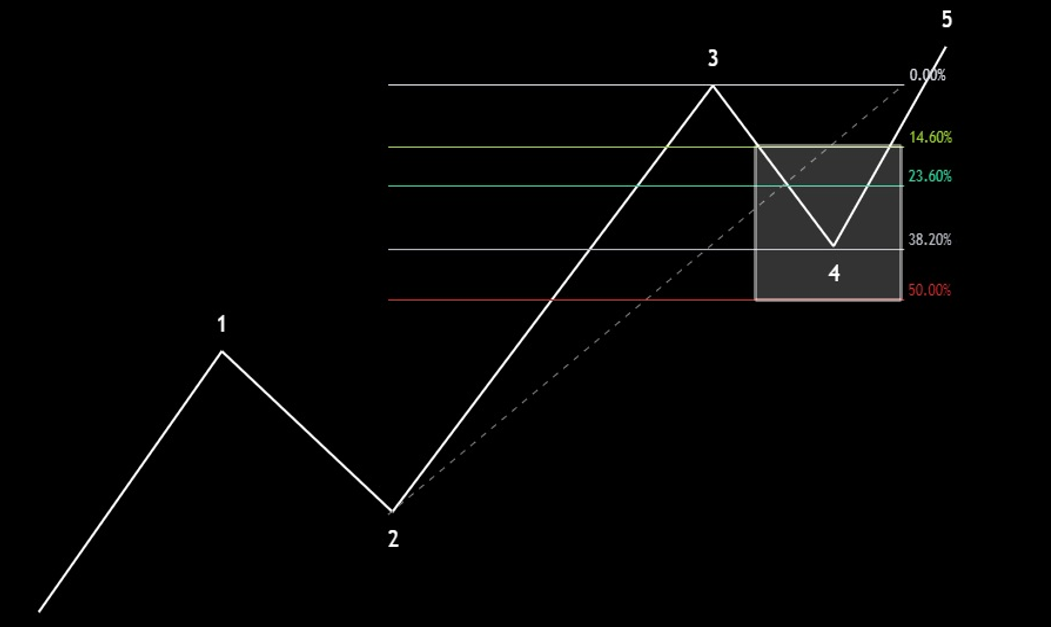
Figure 4.3 – Diagram: Wave 4 Consolidation Pattern
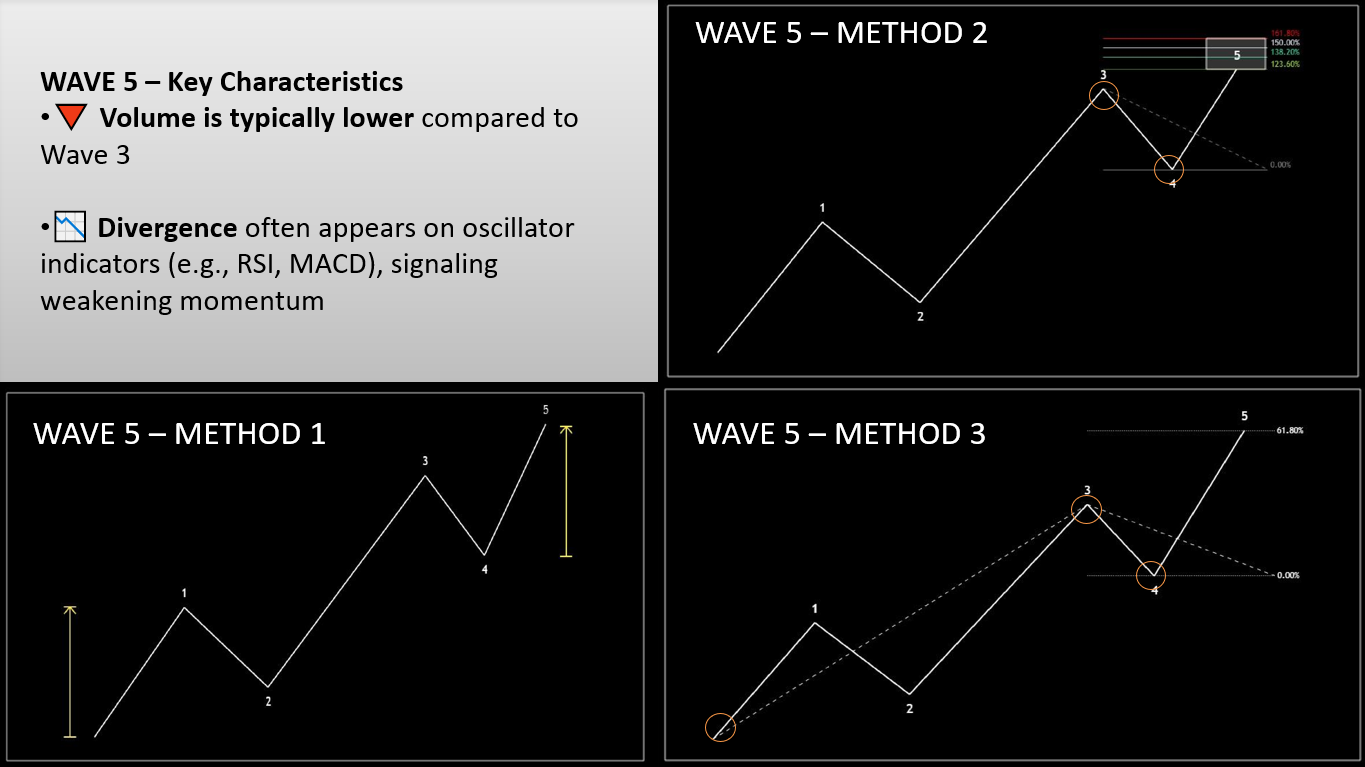
4.4 Wave 5: The Final Push
In the last upward surge, Wave 5 is often driven by a smaller subset of market participants. Although new highs are reached, the diminished momentum and early signs of divergence serve as cautionary flags, signaling that the trend may be nearing its climax.
4.5 The ABC Corrective Cycle
In countertrend moves:
Wave A: Represents the initial, sometimes deceptive, move against the prevailing trend.
Wave B: Often appears as a temporary recovery or false resumption of the previous trend.
Wave C: Finalizes the correction with a decisive move, typically extending to or beyond the magnitude of Wave A, reaffirming the new trend direction.

Figure 4.5 – Diagram: ABC Corrective Sequence
5. Deep Dive into Corrective Waves
Corrective patterns do not conform to the classic five-wave structure. Instead, they predominantly manifest as three-wave formations that retreat against the primary trend. Their identification is nuanced and may only be clearly confirmed in hindsight. Common corrective archetypes include:
5.1 Zigzag Patterns
Structure: A 5-3-5 wave form labeled as A, B, and C.
Key Proportions: Wave B retraces a significant portion (often 50–85.4%) of Wave A, while Wave C may extend 61.8%, 100%, or 123.6% of Wave A.

Figure 5.1 – Diagram: Zigzag Corrective Pattern
5.2 Flat Corrections
Flats are characterized by a 3-3-5 structure with several variants:
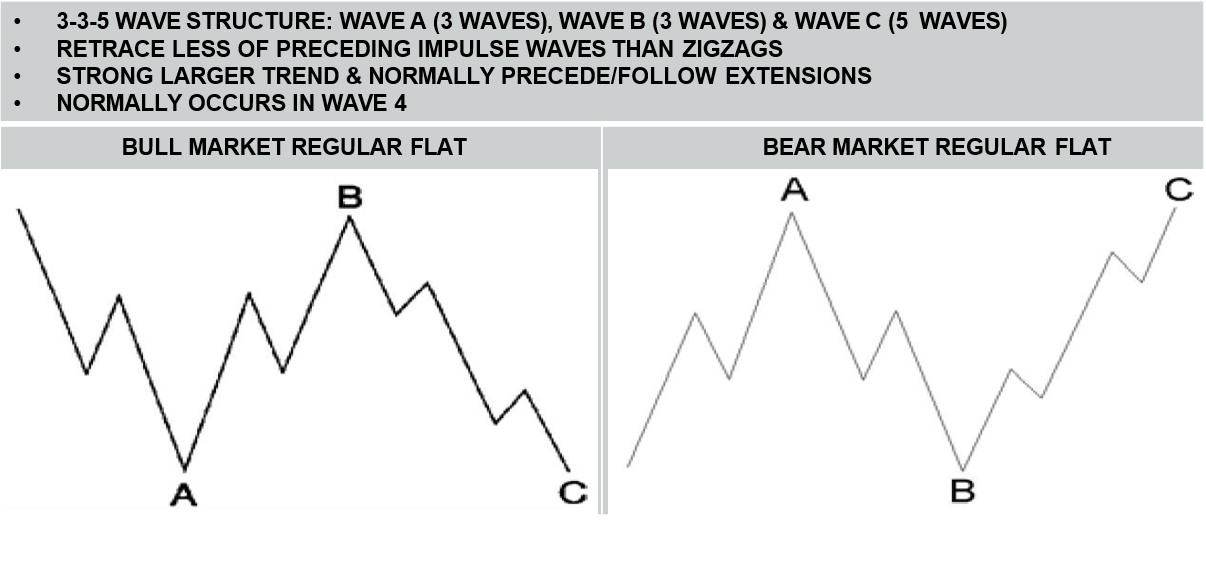
Regular Flats: Wave B finishes near the start of Wave A and Wave C slightly exceeds the end of Wave A.

Expanded Flats: Display an extended Wave B that breaches the start of Wave A, with Wave C moving well beyond the previous high or low.
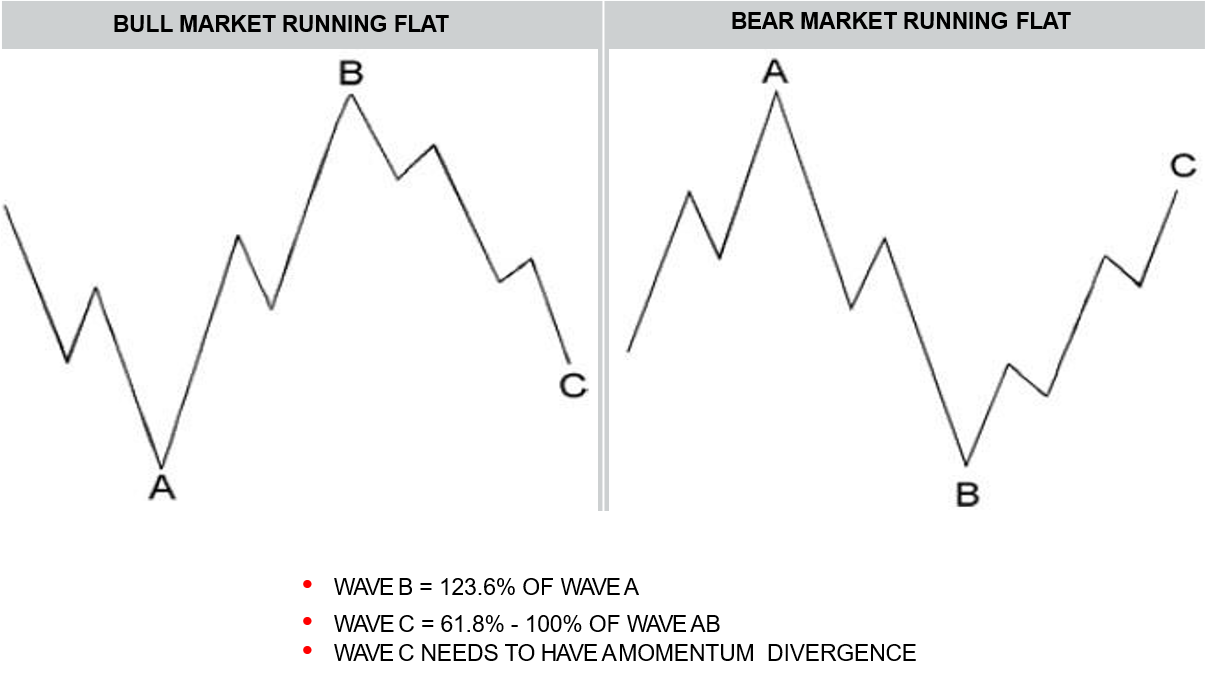
Running Flats: Here, Wave B overshoots like an expanded flat, but Wave C falls short of reaching the level where Wave A terminated.
5.3 Triangular Formations
Triangles, often appearing in Wave B or Wave 4, are marked by a sideways contraction and decreased volatility. Typically forming a 3-3-3-3-3 sequence, they indicate that the market is consolidating before resuming its trend.

Figure 5.3 – Diagram: Triangle Formation
5.4 Composite Corrections: Double and Triple Threes

Double Three: Combines two corrective structures into a complex W-X-Y pattern, resulting in a seven-swing formation.
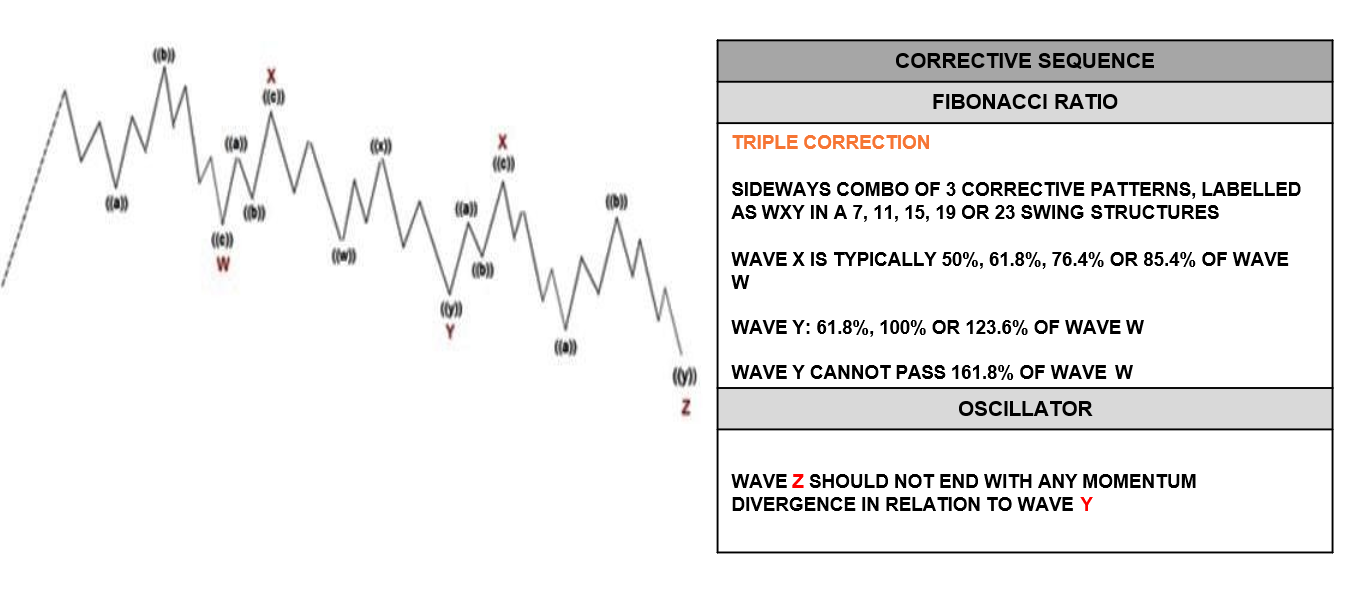
Triple Three: Merges three corrective patterns (W-X-Y-X-Z) to form an eleven-swing sequence, denoting significant market indecision before trend resumption. Each composite corrective must also conform to specific Fibonacci relationships that reinforce their validity as part of the overall wave count.
Conclusion
This guide presents a detailed exploration of Elliott Wave Theory, enriched with Fibonacci’s mathematical rigor, and reinterpreted to suit contemporary market conditions. Whether you apply the classical 5-wave impulse or embrace the more flexible “motive sequence” framework, understanding the nuanced interplay between wave structures and Fibonacci ratios remains essential for sophisticated technical analysis. Traders and analysts equipped with this knowledge can better anticipate market moves, refine entry and exit points, and ultimately enhance their strategic decision-making in today’s fast-paced financial markets.